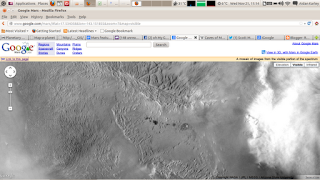
SW of Olympus Mons on Mars (use the "Visible" band of imagery).
(Unlike Google's terrestrial mapping, the option to embed a map isn't provided, so here's a static screenshot.)
What is attracting my attention is the linear feature across the centre of the image. It's approximately radial to Olympus Mons.
It's coordinates are Lat +17.486911 & Long -143.34960.
So, WTF is it?
Checking the Gazetteer of Planetary Nomenclature, I can't find anything listed with a formal name at (vaguely) those coordinates. The range of possibilities includes (sorted by latitude)
Name Diameter Latitude Longitude -->
| Pangboche | 10.16 | 17.28 | 226.6 | |
| Turma | 6.68 | 17.31 | 108.11 | |
| Yala | 19.65 | 17.37 | 321.42 | |
| Nutak | 11.26 | 17.41 | 329.74 | |
| Banff | 5 | 17.51 | 329.29 | |
| Nune | 8.47 | 17.55 | 321.24 | |
| Marbach | 24.74 | 17.65 | 111.03 |
| Dokka | 51.1 | 77.17 | 214.24 | |
| Lycus Sulci | 1350.61 | 28.14 | 215.53 | |
| Gordii Dorsum | 481.56 | 4.11 | 215.86 | |
| Amazonis Sulci | 250.59 | -2.15 | 216.29 | |
| Koval'sky | 296.67 | -29.56 | 218.46 | |
| Nansen | 74.63 | -49.92 | 219.58 |
A reality check : am I looking at the correct regions? "Pangboche" is a feature on Olympus Mons (named for a Tibetan monastery on the approach march to Mt Everest base camp). "Lycus Sulci" is an albedo feature spreading around the west and north-west of Olympus Mons. So, I pass the reality check, and I'm looing at the right ranges of names.
No matches. So no-one has given it a name previously.
The next of NASA's suggested resources is Map-a-planet : what can that tell me?
Well, the MOLA (Mars Observer Laser Altimeter) dataset indicates that this feature forms a modest topographic low. And the feature is visible in the other base maps too, which is a good sign (not an observing artefact then).
Moving on then to the USGS's Mars Geographical Information System (GIS) at Mars Global GIS I can check dimensions : it's about 140km long. Which is not unreasonable for a large dyke system (but I'm hypothesising ahead of data).
There are also a number of other sub-parallel features in the topography and basemap data.
Well, that's where I am at the moment. There's a real feature there, but what it is ... I don't know. I can't find any names in the region, which suggests that it hasn't received too much specific attention. And I'll continue later.
Continuing research ... Searching Google for related terms ...
ESA have been looking at the O.M. aureole. Not in this exact area, but close (222° East and 22°North). See http://www.esa.int/SPECIALS/Mars_Express/SEM59O67ESD_3.html
http://www.esa.int/SPECIALS/Mars_Express/SEM59O67ESD_0.html ... pretties, but concentrated on landslip deposits to N and slightly E of my target location.
Searching for "mars olympus mons linear feature" ... http://geology.geoscienceworld.org/content/27/3/231.abstract discusses the origin of the aureole, including evidence for slump faulting in the area. Not (particularly relevant).
http://www.solarviews.com/eng/marsvolc.htm gives an overview of volcanism on Mars, but nothing specific for this region.
nkma.ksc.nasa.gov/mars/mgs/sci/fifthconf99/6050.pdf"These features possess very narrow (~35 – 45 m) crestal axes, are more resistant to erosion than the adjacent terrain, show a lack of stratigraphy in their vertical faces, and have a “meandering” strike consistent with the characteristics of terrestrial dikes. Inspection of Viking Orbiter images suggests that some dike segments may be 100 – 150 km long, with maximum lengths >300 km." This study certainly shows dykes and they're in the appropriate area and scale. Includes mention of possible dyke interactions with groundwater leading to pyroclastics / phreatomagmatic eruptions. Which might give the colour changes.
(file saved locally as "fifthcon99-6050.pdf") Some of these "pyroclastics" overlie lava flow edges.
www.lpi.usra.edu/meetings/lpsc2012/pdf/2186.pdf discusses aspects of the photographic interpretation of the landscape.
(Page 3 of this Google search ... and I'm being self-referential! wellsite-geologist.blogspot.com/2012/11/strange-thing-on-mars.html)
Sixth International Conference on Mars (2003) 3149.pdf : looks at debris glaciers - interesting, but not relevant.
Icarus 181 (2006) 388–407 : looking at more piedmont glaciation. Which is good,but is to the N of the area I'm interested in.
2012-11-22 07:00
Woke up and thought of "HiRISE swathes". Checked phone to find that @doug_ellison (one of the @marsroverdriver crew) was suggesting particular swathes. t.co/HXICl0em t.co/2qDzxgLc are the (shortened links) to swathes he mentions. (Side issue - why didn't this tweet appear in the computer feed, but is on my phone ... meh!)
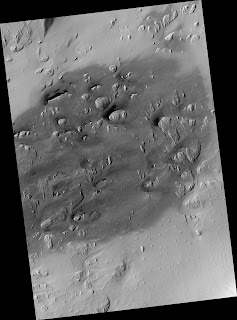
Swathe 1, t.co/HXICl0em decodes to "http://hirise.lpl.arizona.edu/PSP_009502_1980", where "chriso" discusses that the "dark spots" appear to be in contrast to the general ground lightness, which is ascribes to the general ground being mantled by light-coloured dust while the dark spots have relatively dark "basaltic sand". (This gels quite well with what we saw a couple of years ago on holiday to Santorini, with some beaches being of "black sand" and others of creamy-white pumice fragments. There's more going on there than grain size and chemistry, but that's good enough for this range of viewing.) There are certainly variations in the intensity of the blue colour, which would look like a variation in the amount of light dust present (or in the effectiveness of dust removal - in this view, it looks more like a deflation basin to me, perhaps. I'm looking very much at the blue patch between the central pinnacle and the main hill, and at the area just west of the main hill.). "chriso" describes alternating layers of dark and light material, but only in the darker areas ; maybe s/he's looking at higher resolution data, but I can clearly see three light-dark alternations south form the central pinnacle, which extend towards the east of the shot. (I'm assuming, perhaps wrongly, that the image is displayed in north-is-up orientation. EDIT : that's confirmed by the footer metadata - N=up.) The footer also includes a context shot from MOLA imagery, which puts this at the West end of the chain of dark spots.
Oh, hang on - that top-of-the-page image isn't the science image ; that's hidden in the background which links to PSP_009502_1980_RED.browse.jpg (naming convention PSP = tool name? ; orbit number ; image number?) So, moving back on to the science image ... OK, now I see the "headline" image in the science image, and NOW I can see that the light-dark banding is more-or-less confined to the darker areas (it looks rather like Moire fringing to me - and looks like the light-dark banding is shallow-dipping undulating layering irregularly dissected). The appearance of a deflation area is enhanced, with deflation stronger around particular peaks, and particularly to the W/ NW of the peaks.
Swathe 2, t.co/2qDzxgLc decodes to "http://hirise.lpl.arizona.edu/PSP_003450_1975"
(OK, straight to the science image! PSP_003450_1975_RED.browse.jpg)
Oh yes, now that I've got my eye in, that's looking very deflationary also the "Moire fringe" pattern of the light-dark alternations.
OK ; I'm convinced now that these are essentially "deflation features". With access to the HiRISE images, it's quite clear.
This still leaves the question of why it's particularly in this area that it's happening. I'm going to guess that there's a regular wind pattern here (there's a topographic feature associated). Perhaps katabatic winds descending off O.M. with some topographic channelling.
Looking at the raw HiRISE data. (Well, not RAW raw, but the RDR data set (flat-fielded and stitched together, maybe rotated to North-is-up too.) At 341MB for a randomly selected file, I think that I need to be a touch more selective.
Are there mirrors nearer than Arizona?
So, I've been bimbling around for a bit, not really sure what I'm looking for. But I'm getting closer to a (data) product specification.
Having come across the original interesting feature by browsing on Google Mars, the obvious way to follow up would be a similar graphical interface that would display the footprints of the various imagers (and other data sources - landers) onto the image/ topography base map. Whether the GUI is directly linked to the source data is another issue (lots of different formats, I'll bet), but simply knowing "this area has been imaged by mission X (at time Y)" would narrow down the search space greatly. (which would mean fewer "WTF is that" conversations)
I see that the "submit-a-request" section of the HiRISE http://hirise.lpl.arizona.edu site does something along these lines already. ... And that's the only such site that I've found so far. ... OK, got myself an account. So, seeing target suggestions, HiRISE footprints, CTX, CRISM and MOC footprints.
Just as an eyeball ... what's the coverage? MOC, several % ; CRISM another % or so ; CTX is close to 100%, maybe a bit over ; HIRISE another % or so. (These are for the area W of and including OM.) It's a bit slow on the browser, but it tells me WHERE there is data, and the (it's a Google-Maps based tool) annoying little push-pins link to the actual science image (making them not-annoying!)
OK, I can see a (convenient) link to high-res data. And previously I've seen that it is common (required? I wouldn't be surprised) for the source image to be cited in papers based on it ... so my next task would be to collate (and collect, why not?) a list of images over the area of interest, and then search for papers that cite those. Without a science library, I'll have a choice of Google or something else. But that should be sufficient for my purposes.


