Pages that I visit a lot.

2021-06-24

Slashdot posting, 1950 astronomical transient

"Exploring nine simultaneously occurring transients on April 12th 1950"

A new (potential) Slashdot submission. This is my working copy.

Working Title : Did you see that?

Paper : https://arxiv.org/pdf/2106.11780.pdf

9 authors, including one un-person (Geoff Marcy) from 10 institutions from the USA, via Spain (Gran Canaria), Sweden and the Ukraine, and ending up in India. In other words, the usual international football team.

A paper just published on Arxiv, the astronomy/ physics/ computing/ mathematics preprint service, describes studies into old astronomical data sets, to prepare the ground for the "transient" phenomena which will be discovered by new "repeated survey" telescopes. These will photograph the whole sky every few days, capturing novae and supernovae, many new Solar system bodies, the new "mega-constellations" of thousands of satellites, and other, more surprising "transient" phenomena.

In the early 1950s the then-new "200 inch" Hale telescope at Mt Palomar was employed in performing a sky survey. They would take a plate (literally, a glass plate ; this was long before electronic image capture) with a blue-sensitive emulsion, then a plate with a red-sensitive emulsion ; six days later, another red plate covered the same area (by planned overlap). The middle red plate showed a cluster of 9 objects, covering about a tenth of the full Moon's apparent size, which weren't visible in the previous blue plate, nor in the subsequent red plate. The simplest astronomical explanation is that 9 objects of red colour appeared and disappeared in that time interval.

As astronomers get more short-interval surveying of the sky, they get a better idea of how often such "transients" occur. Individual transients (novae, unidentified Solar system bodies, etc) are not, themselves, rare. But nine, in such a small area, in such a short time period - that is rare.

A sceptic's first question would be - is the data good? Photographic plates are a mature technology - and were around a century old at the time of taking. Nobody knows of a similar "contamination" process. Millions of plates have been scanned into computers after the glassware was replaced with CCD detectors - again, nobody has found a similar set of contamination marks. Ideas such as grains of dust from the Alamagordo atomic tests getting onto the plates (and being washed off in the processing) were considered, but it is very unlikely that no other plates for the same manufacturer show similar defects. Human events (matches producing "flares" in spectroscopic observations ; the infamous "Fast Radio Burst" microwave oven) were considered, such as an astronomer with hayfever spraying the plate with snot droplets. But again, why haven't comparable artefacts been found on other plates - and people have looked, digitally, for them! Water drops and processing chemical streaks have characteristic sizes, which these images don't. 

A fragmenting asteroid ("small body") was considered. But that would leave images substantially elongated by the Earth's motion - and only one of the 9 "transients" showed signs of elongation. Some astronomers used to refer to asteroids as "the vermin of the skies" referring to their common occurrence on the sky - invariably through the middle of what you were really trying to photograph. The term is being re-purposed for satellite megaconstellations.

What about a meteor fragmenting in the atmosphere above the telescope? They take too long, and produce even longer streaks than asteroids. They are photographed often enough to be well understood, and this image isn't one of those.

A satellite might produce a short enough "glint" of reflected sunlight. But ... the first satellite was launched 7 years after this image. Unless the launch records from Area 51 say differently.

One event, with 8 reflections from some nearby objects, could work. But with the plate exposure being 50 minutes, the maximum spacing of the reflecting objects is about 30 light minutes, and the size of the spread means the object is about 0.02 light years away. Comfortably beyond the Voyager probes, launched over 20 years later. Unless the launch records from Area 51 say differently.


The obvious next step is to look at existing images of the area taken with newer technology. That has been done. The Pan-STARRS survey (2010 to "continuing" ; to 3.4 magnitudes dimmer than the plates managed - a factor of about 23-fold in brightness) saw nothing there. The Sloan Digital Sky Survey (SDSS, 2000 to "continuing"), to 16-fold dimmer than the plates, saw nothing there.  

To mis-quote Capt.Brody [no, Quint!], "We're gonna need a bigger telescope!" And that is what this report is about. Using the GTC (Gran Telescopio Canaria, 10.4m, ~409in) they photographed the region to a brightness (dimness) of 250-fold compared to the original plates. And they found a number of matches. That's not unexpected : the astronomers estimate the odds of getting such matches by chance as about 17% - far from impossible, but not terribly likely. 

Still, nobody knows what there objects were (or even if the 1950 observation was real)

 (The authors also consider the possibility that in the 70 years between observations, the original objects have drifted out of the field of study - in itself, that would mark them as likely outer Kuiper Belt objects, or Oort Cloud objects. In which case, the question of the simultaneous movement of 9 close objects remains a question. Cue the "I'm not saying it was aliens, but ..." video clip.)


This is a first draft. I'll post it to Slashdot after editing it down a bit.

2021-06-14

Two planets around Kapteyn’s star

 G. Anglada-Escud ́e et al, https://arxiv.org/pdf/1406.0818.pdf with a small football team of co-authors.

I noticed the paper while searching for something else on Arxiv ; the title hooked me, but on second reading I'm realising it's old (2014) work.

Kapteyn's Star is one of the closest stars to the Solar system (well known) ; it's a red dwarf with a parallax of 0.25 arcsec (4 parsecs). It is considered a halo star - a star passing through the Milky Way's disc, but generally residing in the galaxy's halo). Proper motion just under 9 mas/year. Discovered about 1897 in compilation of the Cape photographic Durchmusterung. It has a low spectroscopic rotational speed (v.sin(i) <~3km/s) and low metallicity. It is considered a pretty ancient star, and possibly derived from the Omega Centaurus galaxy's halo into the Milky Way's halo, stripped off during the collision.

Located in Pictor, southern hemisphere. It moves, relatively quickly.

Between 1999 and 2013, using several devices, a sequence of spectra were taken and yield a periodic drift with two period peaks of 121 and 48.6 days.

With a low-mass primary, and relatively large planets (4.8 and 7.0  Msin(i)_earth) the orbits seem stable on the 10 Gyr timescale (appropriate for a merger star).

This work has been challenged several times, but seems to survive it reasonably well.

2020-07-26

Beringia Bathymetry

The question of the "peopling of the Americas" has arisen - again. A claim of a 30-odd kyr collection of worked points suggesting a very pre-Clovis occupation. Interesting, but the "tools" aren't wonderfully convincing.
A while ago, I looked at the seabed of Beringia - I think some idiot (Musk? or one of his hangers-on?) had suggested tunnelling a "hyperloop" from Anchorage to Vladivostok or some such stupidity. Well, here's the seabed topology :
(Figure made with GeoMapApp (www.geomapapp.org) / CC BY, using GMRT data from Ryan, W. B. F., S.M. Carbotte, J. Coplan, S. O'Hara, A. Melkonian, R. Arko, R.A. Weissel, V. Ferrini, A. Goodwillie, F. Nitsche, J. Bonczkowski, and R. Zemsky (2009), Global Multi-Resolution Topography (GMRT) synthesis data set, Geochem. Geophys. Geosyst., 10, Q03014, doi:10.1029/2008GC002332.)
From the tunnelling point of view, the shortest route involves a sump at 40 or so metres below sea level, plus some actual rock thickness below sea bed - unless you want your tunnel/tube exposed to wave activity, which is a whole 'nother world of engineering fun. The Musk-o-philes don't seem to think of things like that - they're seriously disconnected from reality. Oh, the tunnel is evacuated, which is goign to make every extra 10m of water quite a significant load for collapse loads.
To the state of Beringia at the alleged time of the settlement of the Americas, the southern margin seems to have been a complex of small islands - good for island-hopping by small craft ("kayaks" or equivalent) and that would have been the case for a long time before and after the sea level low stand, but the islands changing in detail.
Humans probably had raft, if not small craft technology from around 60kyr BP, when humans made it to Australasia. Combining that with sewing - for making tailored clothing - and most subsequent humans would have had most of the technologies to island hop along the south coast of Beringia and/ or the Aleutian islands without making any irreversible "leap of faith" journeys. Since humans had been doing this along the preceding 10,000km of the Asian-Pacific coast, it's almost surprising that it took so long for humans to reach the Americas.

2019-06-18

Sector collapse

When we were doing the Vulcanology trip to Tenerife, a couple of the stops were to examine the faults bounding the Guimar (SE coast) and Santa Cruz (N coast) collapses. Always worth thinking about, even without the fears stirred up by that Portsmouth (?) hazard research centre.
Well, Prof Ceiling Cat Emeritus has been posting about his current jaunt around Hawai'i, and one look at the geography of Oahu made me think "sector collapse" again.
Oh dear, that's not good looking. That looks like lumps of islands 10km by 20km which have broken off and slid over 50km down the seabed slope.
What does the profile look like? (following the white line in the bathymetry plot)
10km NE-SW by 20km NW-SE by 1.5km thick. That's a big chunk of rock. The tsunami that hit the Pacific coasts (and particularly the British Columbia to Washington section) would have been ... unhealthy to see. I wonder what the date was.

For comparison, here's the most recent slump from the North side of Tenerife.

(250m bathymetry contours, bolded at 1000m intervals, for all images) The characteristic "lumps on the sea floor" of a slump can be seen. In the profile you can estimate the thickness of the largest lump, though this slump seems to have fragmented more than the Hawai'i example above.
 To a first approximation, say 5km by 3km by 0.25km. More detailed mapping with sonar shows that a lot of the seabed has rough areas which are interpreted as earlier generations of slump. Upwards of 20 slumps have been identified around the Canaries archipelago. 
Probably the most recent slump around Tenerife (unless it has "gone" while I'm typing) is from the side of the island facing Gran Canaria.
 The profile shows how steeply the islands drop off away from the volcanic centres.
Note the level of the inter-island gap - 2.5km below sea level - compared to the abyssal plain to the North at over 3.5km below sea level. There is around a kilometre of fill in this gap which hasn't accumulated to the North.

 Since the turn of the millennium there has been considerable speculation about the possibility of major landslides from the flanks of volcanic islands in general, and the Canary archipelago in particular. While concern about the particular claims concerning a West-flank collapse of La Palma have somewhat abated, there are certainly major landslip features around ocean islands. The recent (22 December 2018) flank collapse of Anak Krakatoa in the Indonesian archipelago killed over 400 people, making the point that these things do indeed happen.  

2019-05-30

Slashdot submission : An alternative, but common, astronomical habitable zone

Another interesting paper caught my attention.

Yet another provocative paper emerges onto Arxiv from Harvard's Lingam and Loeb.

Today they estimate the volume of space occupied by habitable zones (regions where liquid water is stable) in brown dwarf not-quite stars. They find that it could be orders of magnitude greater than the volume in the atmospheres of Earth-size planets.

Brown dwarfs are masses of gas which are too small to sustain nuclear fusion (so, they're not stars), but can have a brief period of fusion of deuterium or lithium shortly after formation (so they're not planets ; the boundary size is under debate). After this burst of energy, they slowly cool, for billions of years. This leads to a large volume of the star's outer body — or atmosphere — with potentially attractive temperature and pressure. If the brown dwarf is orbiting with a larger star, there may be enough light to allow photosynthesis. Supply of chemicals is uncertain, but not impossible.

While this paper is speculative, the prospects for detecting such life by spectroscopy are plausible with observational instruments being designed at the moment.

Previous work on abiogenesis and the origin(s) of life has speculated that life could persist in the atmospheres of Venus and Jupiter, using comparable pressure-temperature arguments. In this respect, the proposal is more conventional.
I don't know what they're putting in the water at Harvard, but Abraham Loeb is producing a lot of interesting stuff over the last year or so. 
If Slashdot take up the submission, I'm expecting the nerd-claimants there to raise questions about the availability of chemical elements. I don't see that much of a problem, since the relatively gentle convection on Jupiter (driven by the heat release of helium settling down though the hydrogen) is enough to put interesting amounts of hydrocarbons, ammonia, sulphur compounds up to almost the tops of the clouds, producing the visible colour bands and belts of the planet. If anything, the convection on a brown dwarf would be stronger, bringing heavier elements to higher in the body's structure. (Like Jupiter, unlike Venus, it probably doesn't have a fluid-to solid "surface".)
There remains a "dilution problem", but life managed to get around that on Earth, so I don't see that as a killer argument. 
Quite similar arguments about internal temperatures were being knocked around when Brown and Batygin produced their "planet nine" proposal in early 2016, and people were trying to work out if it would be detectable in infra-red detectors. That Brown is now (2019) getting surveying time on the Subaru telescope says what the rest of the astronomical community thought about that. 
Planet Nine (BB2016 ; there are others in the literature) is estimated to be around 10 Earth-masses (about 1/32 Jupiter-masses) so will have cooled a lot faster than a Jupiter-mass planet, let alone a 30 Jupiter-mass (mid--range) brown dwarf. So that proposed planet isn't a credible life habitat. Well, it's less credible than Europa.

2019-04-18

Slashdot Submission, A second Interstellar object?

In the aftermath of the recognition of 1I/`Oumuamua as an object originating from outside the Solar system, people have been trawling through the archives for other possible similar events. One such archive is CNEOS, which incororates a list of fireballs - objects that have hit the Earth's atmosphere such as the 2013 Chelyabinsk meteor, or the powerful event over Russian Kamchatka in December of last year.
Searching this database a small event (about 100tons TNT equivalent) of 2014 stood out - the orientation of it's path, time and date allowed it's trajectory to be worked out and back-tracked, showing that it probably came to Earth from outside the Solar system. Before entering the Solar system, the object had a velocity of some 43.8km/s with respect to the Sun and was slightly accelerated by the Earth's gravity before impact. When compared to the "Local Standard of Rest" (LSR, the vector of objects orbiting the galactic centre with the Sun), the object's computed speed was some 60km/s, and at This implies that it was never bound to the Sun. Unlike 1I/`Oumuamua, the bolide was also at a considerable angle to the LSR. If accepted as an interstellar object, this second such body starts to flesh out the size and frequency distribution of such events. The possible power-law distributions within these limits are compatible with the distribution of small Kuiper Belt Objects, which includes objects liable to be scattered from the Solar system in future stellar encounters.
The location of the fireball - above the Pacific Ocean NE of Papua New Guinea does not make finding remains very likely. However, the last word of the paper's Discussion is "panspermia" so "Aliens" graphics can be used.

I need to do a bathymetry for this one too.

Put onto Slashdot as a submission.

I've done the bathymetry. The red star shows the location of the fireball ; the white line is the line of the profile.

Data is from GMRT and CNEOS, plotted using www.GeoMapApp.org.

2019-04-11

Pleistocene Indonesian bathymetry

With the recent announcement of another quite old, non-human hominoid in SE Asia, once again people are asking questions about how such humanoids got there, as if these non-human animals were stupid, or incompetent, or ... whatever reason.
So, I did a bit of bathymetry work, since I've got tools to hand. I'm sure I'll use these again.
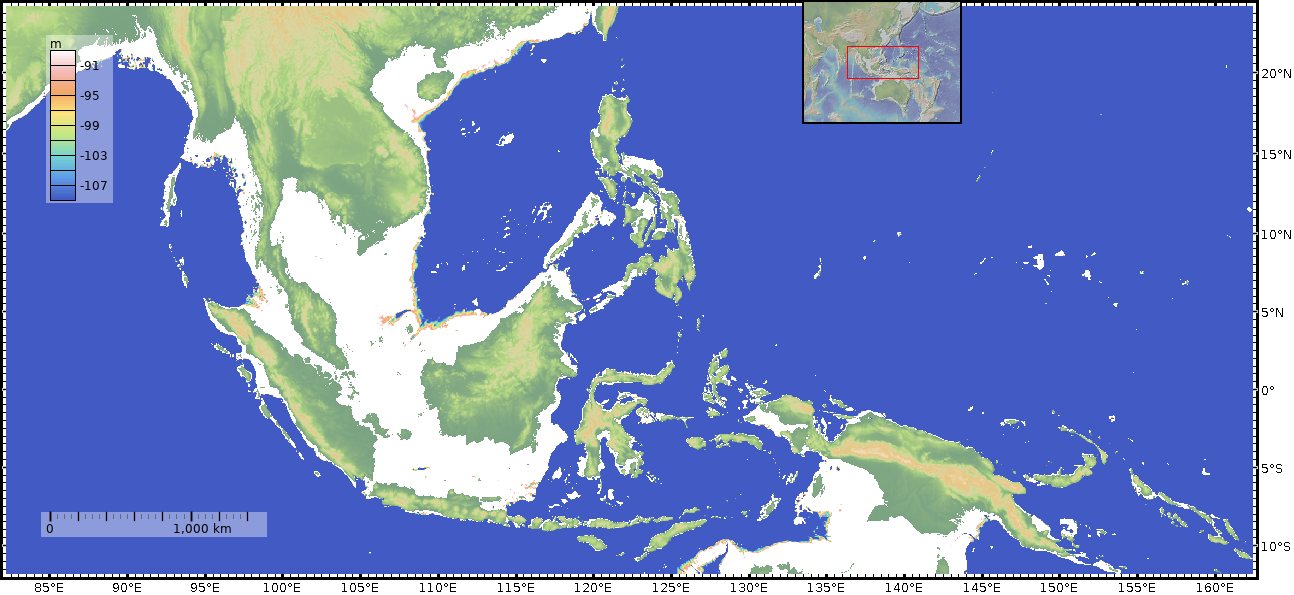
The common estimate for the decrease in sea level (compared to today) at the height of the last ice age, is 100m, so I've adjusted the rainbow colour scale to cover the 90-110m range ; anything deeper than that is marked in blue ; anything shallower is white ; present day exposed land is given an altitude palette.

Is Luzon isolated from the mainland by deep water? 

Bathymetry map SE Asia, 100m cut-off
On this first plot, there is an obvious wide gap to the north. It actually goes down to several km depth, but since you normally drown in the top few metres of water, that doesn't really matter. The minimum sea passage is several hundred kilometres. That's quite a challenge.

Phiippenes Bathymetry 100m cut-off
 Moving to the southern approach, the question is more complex. At a 100m lower sea level, there is no "dry" route to Luzon, but several of the channels are down in the few-tens of km width. These would certainly be easier for people to have crossed, regardless of their species. Whether that is how the Luzon hominids got in ... is at the moment a judgement call. But if I were looking for places to search for bone-bearing deposits, that's where I'd start. 

This next picture I just anticipate I'll need at some point. Constructed from the same data (GMRT) and with the same shading to differentiate 100m+ versus 100m- water depths, it shows the context of the Homo Floresiensis discovery site (Liang bua cave, my typo). You will note that at least one water crossing of about 30km or larger is needed to get from mainland Asia to Liang bua.
The sea to the north of the two Nusa islands is known as the Flores Sea, for which the species was named.

Plots done using GeoMapApp, www.geomapapp.org and the GMRT dataset they pick up.

2018-04-07

Fake dinosaur footprint.

Very quick post.

Geology class
A faked dinosaur footprint. A4 clipboard for scale.
On a field trip to Arran.
In 1985
We don't know who carved this fake dinosaur footprint, but the carver didn't notice that he (she?) cut across several sediment beds (NNE to SSW lineation in this view), marking it as an evident fake.
Photo has suffered from fungus and bad storage for years before being scanned. The carving is pretty unrealistic too.
Prompted by the footprints recently reported from Skye.